
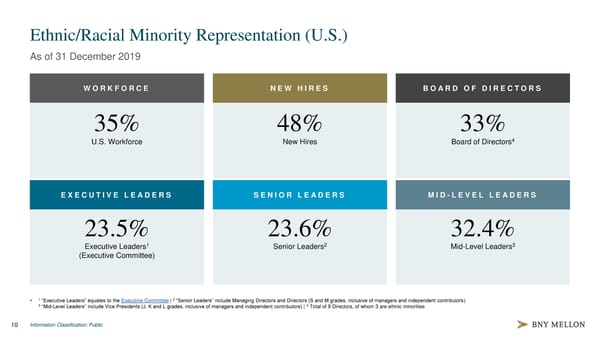
Ethnic/Racial Minority Representation (U.S.) As of 31 December 2019 WORKFORCE NEW HIRES BOARD OF DIRECTORS 35% 48% 33% U.S. Workforce New Hires Board of Directors4 EXECUTIVE LEADERS SENIOR LEADERS MID-LEVEL LEADERS 23.5% 23.6% 32.4% Executive Leaders1 Senior Leaders2 Mid-Level Leaders3 (Executive Committee) • 1 “Executive Leaders” equates to the Executive Committee | 2 “Senior Leaders” include Managing Directors and Directors (S and M grades, inclusive of managers and independent contributors) 3 “Mid-Level Leaders” include Vice Presidents (J, K and L grades, inclusive of managers and independent contributors) | 4 Total of 9 Directors, of whom 3 are ethnic minorities Information Classification: Public 10
 Diversity & Inclusion Strategy 2020 Page 10 Page 12